
Gambling: Gambling behavior is not related to the socio-economic profile of each player
SOURCE insider

Citizens either like gambling or avoid it depending on their subjective perception of financial risk regardless of their socio-economic profile.
This results from a nationwide survey by the Gaming Supervision and Control Commission conducted in March 2022 with the aim of recording the characteristics and behavior of gambling players.
The survey was designed by EEEP and implemented by an established polling and market research company. The sample amounted to 3.134 people throughout the territory, with scientifically documented stratification and included all categories of citizens based on socio-economic characteristics (gender, age, level of education, type of employment, income, etc.). The questionnaire was structured in a methodologically sound way and covered all aspects of the respondents' gambling behavior (for example, which games of chance they know, if and how often they play, amounts they play, time they spend gambling, etc.) .
Based on the results of the research it is of particular interest to investigate the relationship between socioeconomic characteristics and gambling behavior; In other words, what makes Greeks like games of chance or avoid them? Are education, income, type of employment and so on, the factors that significantly influence this choice or not?
The answer is given by the statistical analysis and specifically by the test of independence between the various characteristics. The combinations are many, however in all cases the results were statistically insignificant which means that gambling behavior is not related to socio-economic profiles.
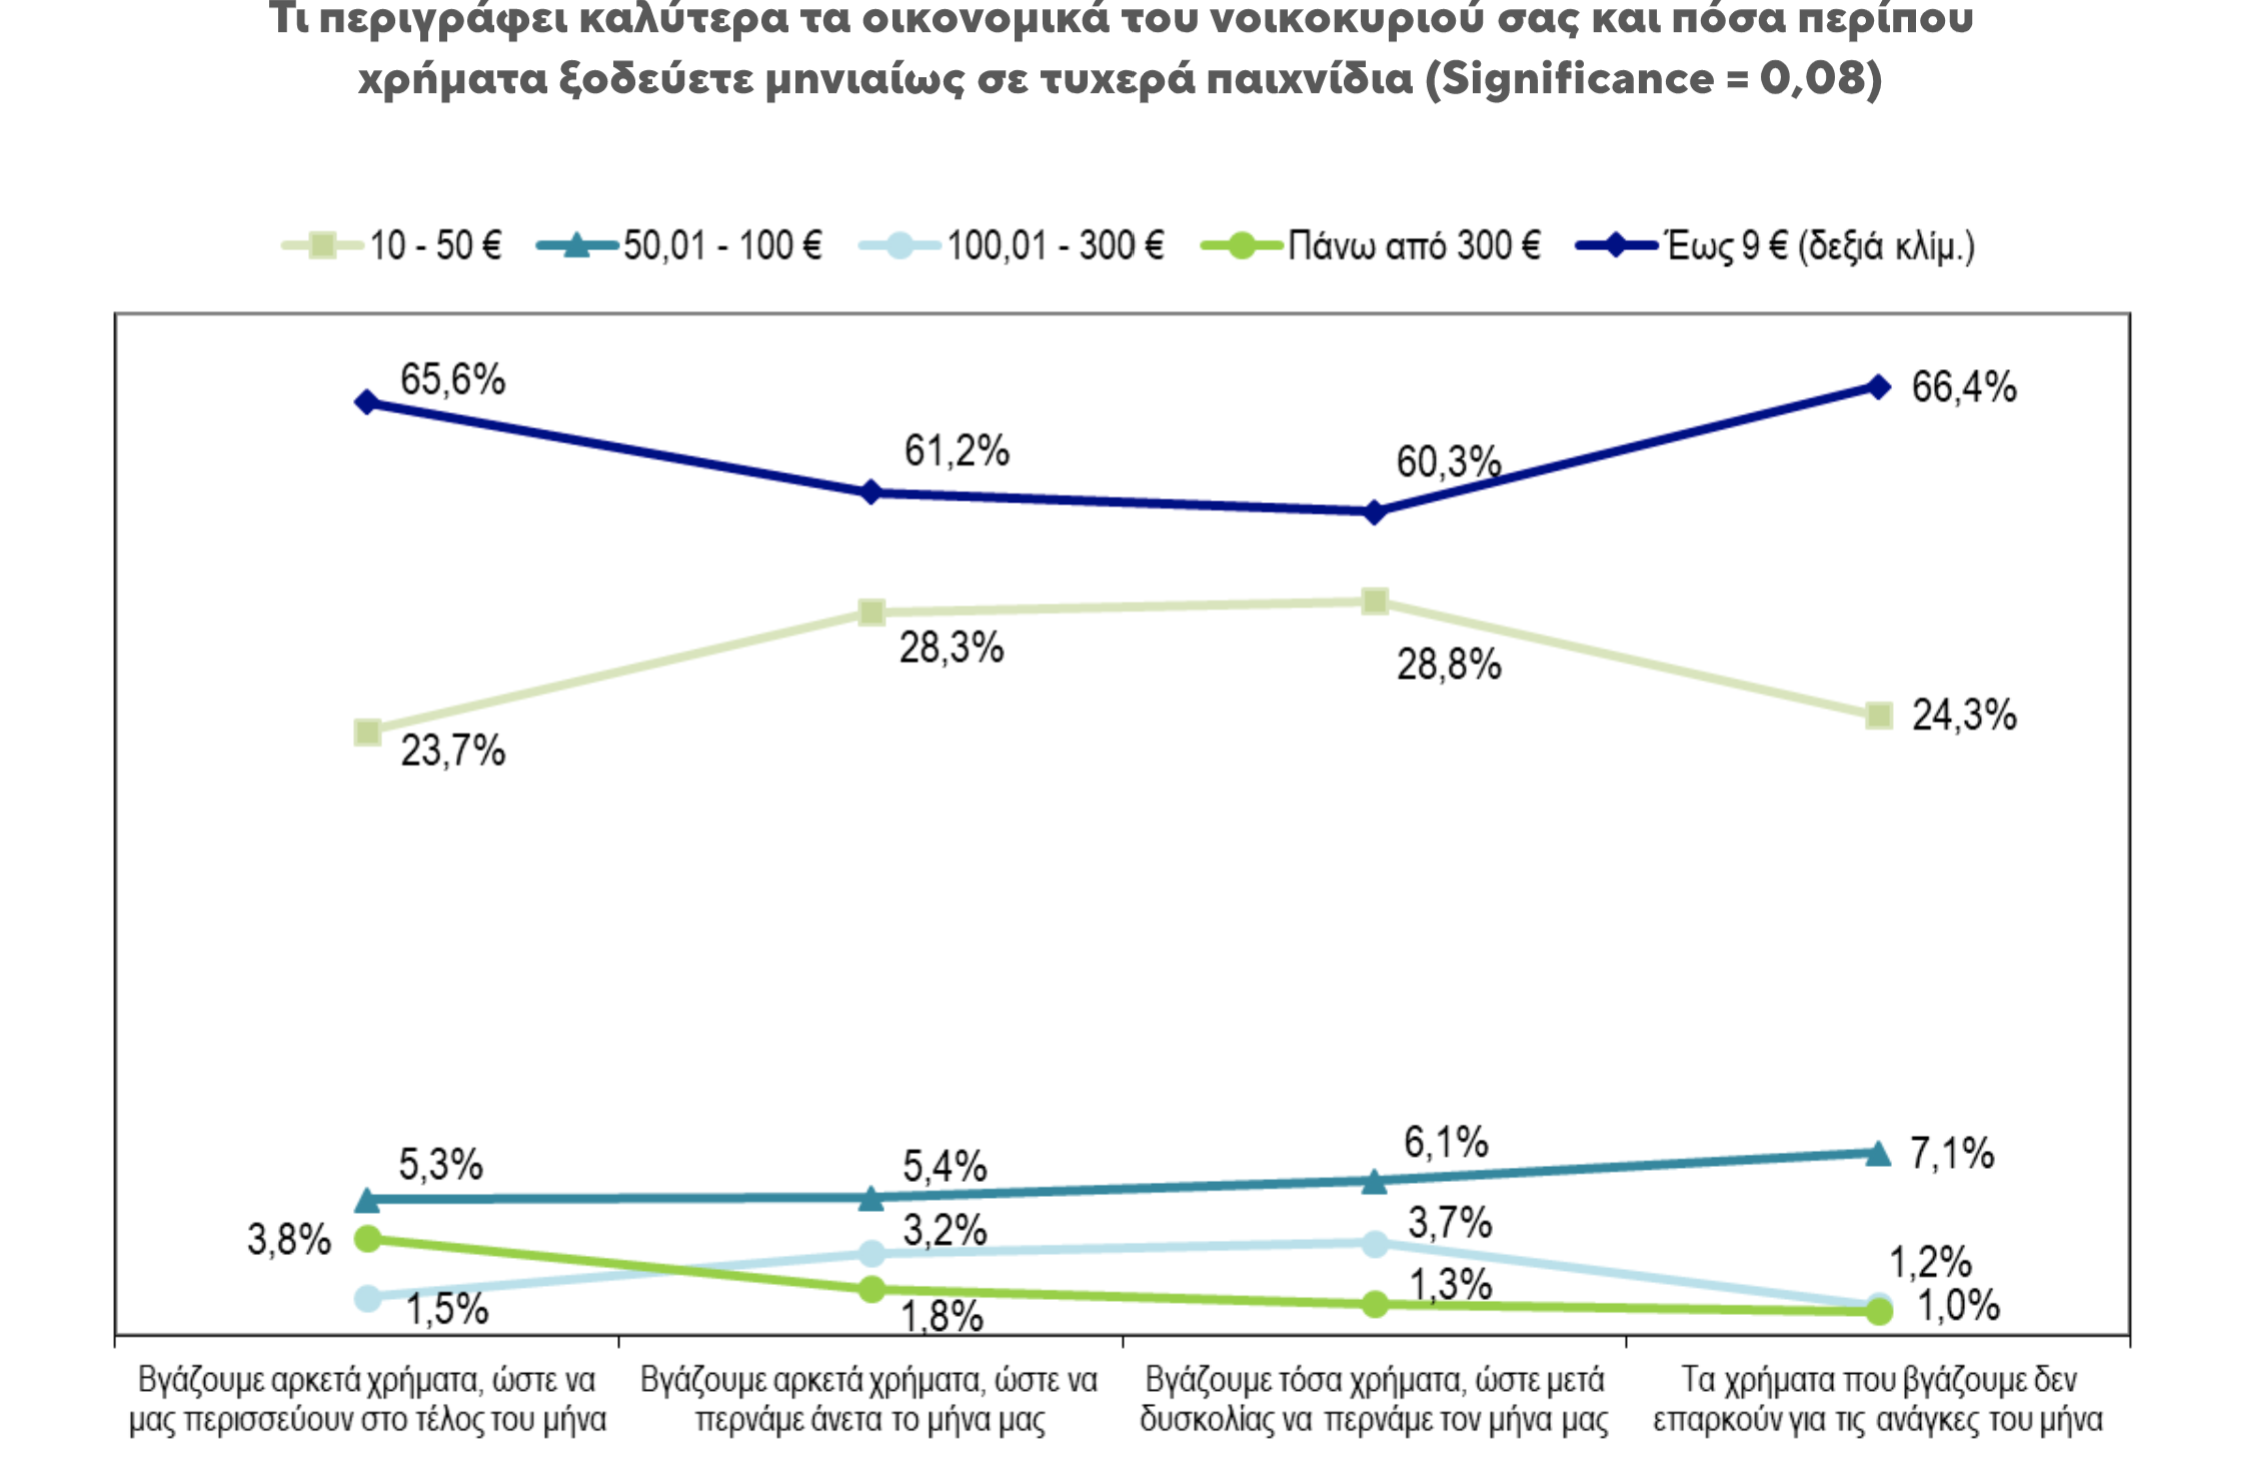
Characteristic are the two charts that show the relationship between the household's financial situation and the time and money they spend on gambling.
It is observed that the percentages per week of time and amount of money that players devote to gambling do not differ significantly between the four categories of household finances.
Specifically:
- The largest percentage of Greek players play up to 9 euros per month. Specifically for households that make enough money to have a surplus at the end of the month, 65,6% play up to 9 euros. For those who make enough money to comfortably spend the month, this percentage is 61,2%, for those who make enough money to barely make it through the month, the percentage that plays up to 9 euros per month reaches 60,3%, while for for those whose money is not sufficient for the needs of the month, the percentage reaches 66,4%.
- Much smaller are the percentages that spend between 10 and 50 euros per month. For those who make enough money to have a surplus at the end of the month, the percentage is 23,7%, for those who make enough money to get by comfortably during the month, it is 28,3%, for those who make enough money to get through the month with difficulty the percentage reaches 28,8% and for those who make money that is not sufficient for the needs of the month, the percentage is 24,3%.
- From 50 to 100 euros a month they play: 5,3% of those who make enough money to have enough money left over at the end of the month, 5,4% of those who make enough money to comfortably spend the month, 6,1% of those they make so much money that after difficulty they get through the month and 7,1% of the money they make is not enough for the needs of the month.
- From 100 to 300 euros per month, 1,5% of those who make enough money to have enough left over at the end of the month play, 3,2% of those who make enough money to get by comfortably during the month, 3,7% of those who make that much money so that after difficulty I get through the month and the 1,2% of the money they make is not enough for the needs of the month.
- From 300 euros or more, 3,8% of the 100 of those who make enough money to have enough money left over at the end of the month play, 1,8% of those who make enough money to spend the month quite comfortably, 1,3 of those who make so much money that after difficulty they get through the month and the 1% who play how much more than 300 euros are those whose money they make is not enough for the needs of the month.
The majority ranging from 86,4% spend up to one hour per week gambling. 5,9% to 7,9% play one to three hours per week, 3,4% play 11 to 20 hours per week, 1,7% play 4 to 5 hours per week, and 6 to 10 hours per week week and over 20 hours plays a rate of 1,5% or less.
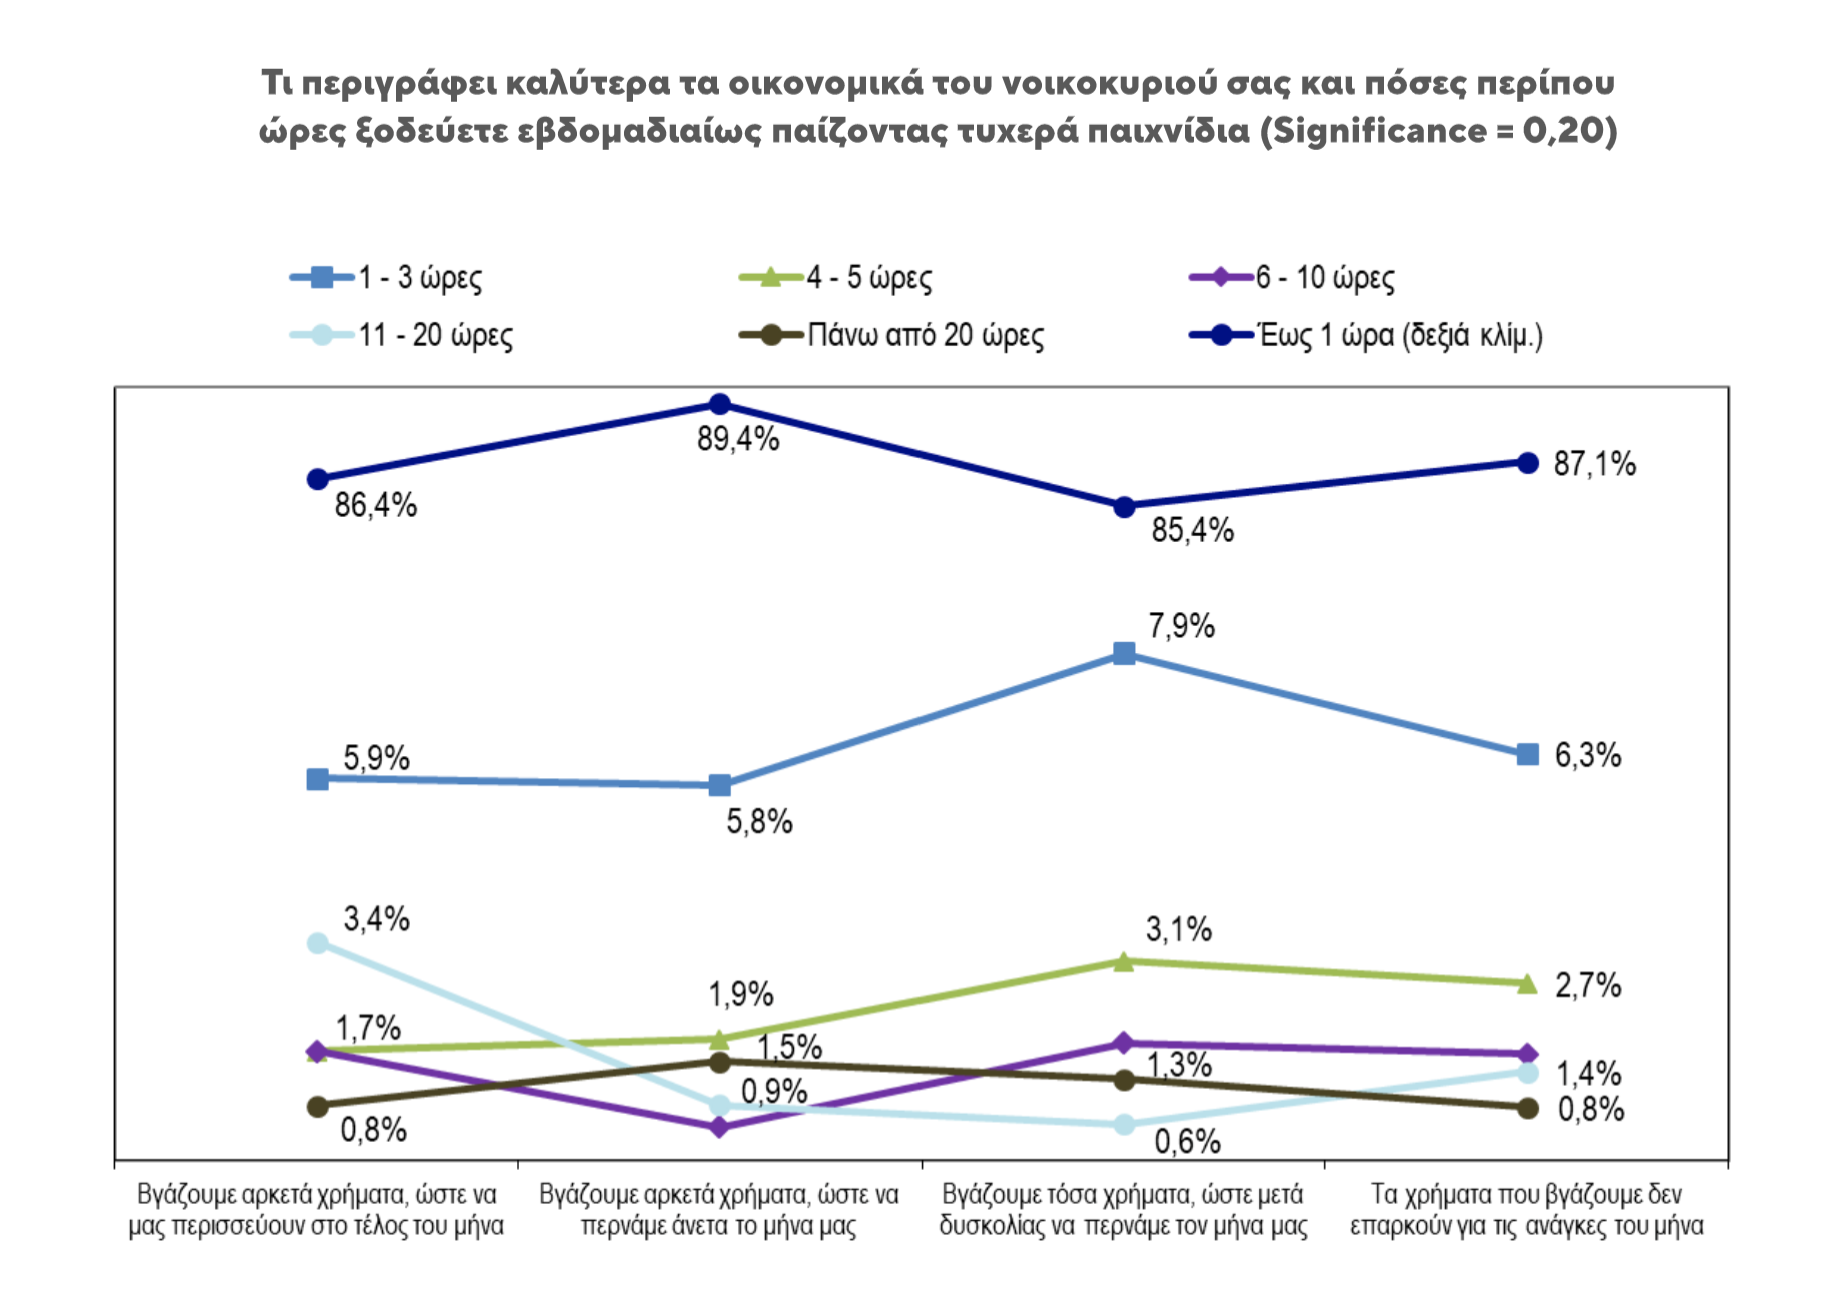
These percentages have small variations depending on the household's financial situation even when and even when the money they make is not enough for their monthly needs.
Consequently, the observed differences are random and lead to the conclusion that both the weekly time and the amount of money gamblers spend on gambling do not depend on the social household's finances.
Correlations with other characteristics, income class, level of education, type of profession, etc., showed similar results.
The reason why gambling becomes attractive to someone or vice versa according to a scientifically sound hypothesis is the temperament of people. For example, corresponding profiles are found in the area of investments. There are risky investors who seek risk (risk seekers), but also conservative investors who avoid risk (risk avoiders).
Analogous idiosyncratic parameters appear to apply to games of chance as well since the choice of time and way of engaging in them seems to be subjective and to be found mainly with the perception that individuals have of the financial risk and not with socio-economic factors such as education, income, occupation, etc.


