
With the condition TRADE VOLUME we mean the pieces / number of shareholders that were traded at the time of the year we are examining (MINUTE-TIME-DAY-WEEK and so on).
Simply put, TRADE VOLUME shows the percentages of money coming in and out of the market.
The trading volume is a key element of the technical analysis and aims to determine whether a price change is upward or downward accompanied by proportional placements, ie
the price movement is accompanied by a corresponding order size.
so the basic price-volume correlation is, please, if we accept that
The + sign is a rise in value and an increase in volume
The symbol - is a decrease in price and a decrease in tumors
Forecast volume is enormous. This is due to
that the volume of transactions usually precedes prices. That is, its change
the direction of the trading volume precedes the price reversal. The behavior
Today's volume shows us how prices will go tomorrow. For this reason the volume
Trading has been a separate field of technical analysis where applicable
techniques corresponding to those of prices.
Following is a list of tumor markers as well as their interpretation
BASIC VOLUME INDICATORS
1.BALANCE TOOL - OBV on balance volume
2.CONCLUSION DISTRIBUTION A / D
VOLUME VOLUME
1.Chaikin A / D (CHO chaikin oscillator)
2.Chaikin money flow - CMF
3.Money flow index - MFI
[h = 3] INTERPRETATION OF VOLUME INDICATORS AND VOLUME AND WAYS TO USE THEM (click on 1 to 5 headers read and download!)[/ h]
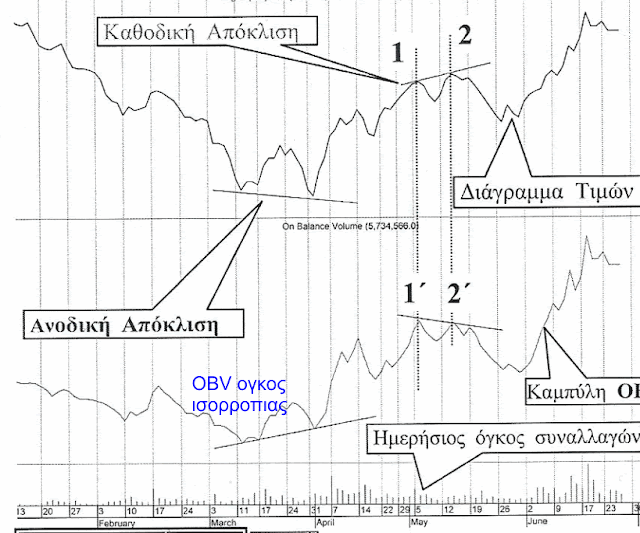
1.BALANCE OBV on balance volume (joe Granville)
specifies when "accumulation" or "distribution" takes place
INDEX CONSTRUCTION
Assuming that the total volume of an uptrend day shows accumulation and a downtrend.
USE
The main use of the index is to identify "discrepancies" between price and index.
so that if the value goes up and the indicator shows a drop or the inverse then the "Possible" reverse of the trend is imminent.
So, at a glance, we see the general picture of trading volume if it is upward-sloping but it shows divergence in terms of price.
2. LARRY WILLIAMS A / D (ACCUMULATION-DISTRIBUTION) INDEX
It is an improved version of OBV which, besides accumulating distribution, also reflects the dynamic behavior of tumors as
accepts that the daily closing price is the medium high-low fluctuation and not the net closing price by matching the addition or subtraction of volumes according to the HI + LOW / 2 value.
Whenever the closing price of the day is higher than the Average of hi + low / 2
then the volumes are added and we have accumulation and vice versa to freeze that we have "distributions".
USE
Similar to OBV
3.TALANFTOTIS chaikin A / D
CONSTRUCTION
The A / D indicator does not provide us with any information on the rate of accumulation-distribution.
this is the difference between the 2 Weighted Moving Average Exponentials (CMA) and more specifically the CMA 10 days A / D difference from the CMA 3 days A / D.
Thus it tells us if the accumulation-distribution is done at a higher rate (acceleration) now than it was before 10 days.
if it has a positive slope we have accumulation at an accelerating rate while if it has a negative slope the accumulation "slows down"
USE
The exceptions between chaikin and price volatility are of the utmost importance that these volumes and rates of volatility precede price movements.
Use in conjunction with the 21 Days Mobile Average as recommended by its manufacturer.
4.Chaikin Money Flow (CMF) TURNOVER.
CONSTRUCTION
Measure what percentage of the total volume corresponds to the accumulation and what to the distribution (over a period defined by its arrangements).
at a glance we can see what ASSOCIATION or DISTRIBUTION is about.
Oscillates between + 1 and -1
values> 0 show accumulation, while values <0 distribution.
USE
DEFINITIONS-DESIGNING VOLTAGE LINE-DRAWINGS
compare these with the price chart.
Money Flow Index (MFI) 5
CONSTRUCTION
Using the standard weighted closing price H + L + C / 3 (MAXIMUM + MINIMUM + CLOSING FOR 3) and when it is greater than the previous day we have "placements" and when this price is lower than the previous day "flow".
we specify the time period we want-a 20 day period is recommended.
USE
The MFI oscillates between 0 and 100 values below 20 are considered over-sold and above 80 over-booked.
Basically, the MFI measures the degree of '' aggressiveness '' of buyers-sellers, ie if the placements or liquidations are '' dynamic ''.
WE FIND EXCLUSIONS AND PURCHASE INTO 20 LEVEL IF THE MAINTENANCE IS AGREEMENT AND WE SELL WHEN HE IS BREAKING THE 80 LINE AT ALL
IMPORTANT NOTICE.
For all the oscillators, the over-the-counter and over-the-counter levels require utmost care and it is especially dangerous to take these into account only when they do not comply with the MAIN TIME.
it is important that sales or purchases resulting from the resale of over-sold or over-priced talent levels BE MADE TO THE MAIN TREND!
TRADE SYSTEM TESTING PROCEDURE
The main elements that drive the trading volumes are accumulation-distributive placements-fluidization rates and accelerating their metabolism.
So in a proper trading system we also demand volume confirmation by following the steps in priority order
1) we see the general picture through OBV if the tension is in line with the slope of the equilibrium volume curve and we look for any "deviations"
2) we look at the A / D curve with similar modification as with the OBV indicator
3) WE SEE THROUGH CHAIKIN A / D IF ACCUMULATION-DISTRIBUTION HAPPENS WITH QUICK OR QUICK RATES AND WE HAVE A SPECIAL CARE.
4) monitor if the CMF metabolism rate is satisfactory
5) finally we see if buyers-sellers are '' aggressive '' through MFI
NOTE IMPORTANT
At a time when the market is taciturn with a heightened tendency, the use of oscillators requires utmost care.
generally we consult the 2 modes oscillators
1) In sideways or horizontal markets (trading area), where no voltage is observed and small voltage fluctuations are well monitored by oscillators.
2) when they are divergent and through this phenomenon they send warning signals of 'possible' voltage inverters.
Theoretical representation of price volumes as a function of transaction volumes

in real conditions, not always the confirmation of the analogue movement
tumors give an additional indication of this dynamic.
at the bases it is "common" for tumors to grow after rupture if the rupture is "valid".
An example of an upward downward trend in volume and price index
Also see and download MT4 tumor markers below! Click on the links ...
1) VROC VOLUME CURVE
2) VOLUME MA average tumors
3) Williams A / D (not MT4 integrated!)
Simply put, TRADE VOLUME shows the percentages of money coming in and out of the market.
The trading volume is a key element of the technical analysis and aims to determine whether a price change is upward or downward accompanied by proportional placements, ie
the price movement is accompanied by a corresponding order size.
so the basic price-volume correlation is, please, if we accept that
The + sign is a rise in value and an increase in volume
The symbol - is a decrease in price and a decrease in tumors
1) PRICE + VOLUME + = possible uptrend
2) PRICE + VOLUME - = possible upside reversal
3) PRICE-VOLUME + = possible continuation of cathode
4) PRICE- VOLUME- = possible reversal of downward trend.
2) PRICE + VOLUME - = possible upside reversal
3) PRICE-VOLUME + = possible continuation of cathode
4) PRICE- VOLUME- = possible reversal of downward trend.
Forecast volume is enormous. This is due to
that the volume of transactions usually precedes prices. That is, its change
the direction of the trading volume precedes the price reversal. The behavior
Today's volume shows us how prices will go tomorrow. For this reason the volume
Trading has been a separate field of technical analysis where applicable
techniques corresponding to those of prices.
Following is a list of tumor markers as well as their interpretation
BASIC VOLUME INDICATORS
1.BALANCE TOOL - OBV on balance volume
2.CONCLUSION DISTRIBUTION A / D
VOLUME VOLUME
1.Chaikin A / D (CHO chaikin oscillator)
2.Chaikin money flow - CMF
3.Money flow index - MFI
[h = 3] INTERPRETATION OF VOLUME INDICATORS AND VOLUME AND WAYS TO USE THEM (click on 1 to 5 headers read and download!)[/ h]
1.BALANCE OBV on balance volume (joe Granville)
specifies when "accumulation" or "distribution" takes place
INDEX CONSTRUCTION
Assuming that the total volume of an uptrend day shows accumulation and a downtrend.
USE
The main use of the index is to identify "discrepancies" between price and index.
so that if the value goes up and the indicator shows a drop or the inverse then the "Possible" reverse of the trend is imminent.
So, at a glance, we see the general picture of trading volume if it is upward-sloping but it shows divergence in terms of price.
2. LARRY WILLIAMS A / D (ACCUMULATION-DISTRIBUTION) INDEX
It is an improved version of OBV which, besides accumulating distribution, also reflects the dynamic behavior of tumors as
accepts that the daily closing price is the medium high-low fluctuation and not the net closing price by matching the addition or subtraction of volumes according to the HI + LOW / 2 value.
Whenever the closing price of the day is higher than the Average of hi + low / 2
then the volumes are added and we have accumulation and vice versa to freeze that we have "distributions".
USE
Similar to OBV
3.TALANFTOTIS chaikin A / D
CONSTRUCTION
The A / D indicator does not provide us with any information on the rate of accumulation-distribution.
this is the difference between the 2 Weighted Moving Average Exponentials (CMA) and more specifically the CMA 10 days A / D difference from the CMA 3 days A / D.
Thus it tells us if the accumulation-distribution is done at a higher rate (acceleration) now than it was before 10 days.
if it has a positive slope we have accumulation at an accelerating rate while if it has a negative slope the accumulation "slows down"
USE
The exceptions between chaikin and price volatility are of the utmost importance that these volumes and rates of volatility precede price movements.
Use in conjunction with the 21 Days Mobile Average as recommended by its manufacturer.
4.Chaikin Money Flow (CMF) TURNOVER.
CONSTRUCTION
Measure what percentage of the total volume corresponds to the accumulation and what to the distribution (over a period defined by its arrangements).
at a glance we can see what ASSOCIATION or DISTRIBUTION is about.
Oscillates between + 1 and -1
values> 0 show accumulation, while values <0 distribution.
USE
DEFINITIONS-DESIGNING VOLTAGE LINE-DRAWINGS
compare these with the price chart.
Money Flow Index (MFI) 5
CONSTRUCTION
Using the standard weighted closing price H + L + C / 3 (MAXIMUM + MINIMUM + CLOSING FOR 3) and when it is greater than the previous day we have "placements" and when this price is lower than the previous day "flow".
we specify the time period we want-a 20 day period is recommended.
USE
The MFI oscillates between 0 and 100 values below 20 are considered over-sold and above 80 over-booked.
Basically, the MFI measures the degree of '' aggressiveness '' of buyers-sellers, ie if the placements or liquidations are '' dynamic ''.
WE FIND EXCLUSIONS AND PURCHASE INTO 20 LEVEL IF THE MAINTENANCE IS AGREEMENT AND WE SELL WHEN HE IS BREAKING THE 80 LINE AT ALL
IMPORTANT NOTICE.
For all the oscillators, the over-the-counter and over-the-counter levels require utmost care and it is especially dangerous to take these into account only when they do not comply with the MAIN TIME.
it is important that sales or purchases resulting from the resale of over-sold or over-priced talent levels BE MADE TO THE MAIN TREND!
TRADE SYSTEM TESTING PROCEDURE
The main elements that drive the trading volumes are accumulation-distributive placements-fluidization rates and accelerating their metabolism.
So in a proper trading system we also demand volume confirmation by following the steps in priority order
1) we see the general picture through OBV if the tension is in line with the slope of the equilibrium volume curve and we look for any "deviations"
2) we look at the A / D curve with similar modification as with the OBV indicator
3) WE SEE THROUGH CHAIKIN A / D IF ACCUMULATION-DISTRIBUTION HAPPENS WITH QUICK OR QUICK RATES AND WE HAVE A SPECIAL CARE.
4) monitor if the CMF metabolism rate is satisfactory
5) finally we see if buyers-sellers are '' aggressive '' through MFI
NOTE IMPORTANT
At a time when the market is taciturn with a heightened tendency, the use of oscillators requires utmost care.
generally we consult the 2 modes oscillators
1) In sideways or horizontal markets (trading area), where no voltage is observed and small voltage fluctuations are well monitored by oscillators.
2) when they are divergent and through this phenomenon they send warning signals of 'possible' voltage inverters.
Theoretical representation of price volumes as a function of transaction volumes

in real conditions, not always the confirmation of the analogue movement
tumors give an additional indication of this dynamic.
at the bases it is "common" for tumors to grow after rupture if the rupture is "valid".
An example of an upward downward trend in volume and price index

Also see and download MT4 tumor markers below! Click on the links ...
1) VROC VOLUME CURVE
2) VOLUME MA average tumors
3) Williams A / D (not MT4 integrated!)
Last edited:


