
Bollinger strips
During periods of high price fluctuations it is recommended to we define some areas within which prices are expected to oscillate, so to show their support and resistance.
These lanes provide psychologically levels of price trapping but also conditions for waiting for violent reactions (upstream or downstream).
Bollinger strips consist of a simple 20 day moving medium (such as John Bollinger's inspiration), which is surrounded by two lanes.
The strip above KMO appears if we add to it two standard price deviations. The strip at the bottom of the moving medium occurs when
we deduct from it two standard price deviations.
These two lines are typical deviations are the upper and lower limit of the Bollinger lanes.
When volatility and stock fluctuations increase, then the width
of the Bollinger lanes increases as standard price deviates.
Η direction of the Bollinger lanes depends on the direction of the mobile
through 20 days. The behavior of these lanes depends on
behavior of the price trend.
Within a strong upward trend, Bollinger's lanes are limited width and their direction is upward. When the stress matures and shows fatigue, the lanes open as price volatility increases. In a strongly downward trend, the lanes are narrow and downward.
Cathodic strips with increased width, they mean weakening of downward trend.

The trading rules based on the Bollinger lanes are as follows:
The???? An upward breakdown of Bollinger's upper limit from the closing price, shows strong upward trend and gives a share purchase mark.
The???? If the price breaks up the upper Bollinger limit, then it forms peak below this, expecting price retreat and reversal pre-existing upward trend.
The???? Catalysis of the lower limit of Bollinger marks a fall in price, hence we sell the share or product we are trading on.
The???? If the price breaks down the lower limit but then creates a bottom above the limit then a recovery will take place.
The???? The failure of the price to break the lower limit means a possible start of movement until the upper limit and the opposite for failure to break the upper limit.
The???? An upward movement of the value to the upper limit Bollinger will encounter resistance to this.
The???? A downward movement of the value to the lower limit Bollinger will find support at the limit this.
The???? Every effort of the honor to move nervously from the upper limit to the bottom will encounter at least short - term support in the 20 mobile medium and every bounce of the price from the bottom boundary upwards will find resistance to the same mobile media.
The???? After every dramatic reduction in the range of Bollinger lanes we will expect violent price reaction, the direction of which can be predicted by other technical indicators.
The???? Bollinger strips tend to increase their width in areas price spikes rather than base areas.
The Bollinger strips are an index similar to the mobile environments average. The difference between them is the following: the envelopes are formed with predetermined rates above and below the moving average, while the Bollinger lanes are formed with levels of relative deviation from the mean.
Because the constant deviation is a measure of how volatile a stock is, the bands are modified by themselves, ie widen when the stock's variation is significant and narrow when it is variation is small.
Bollinger strips are shown on the same graph as the stock price.
As is the case with the surrounding environments, the basic interpretation of the lanes is that stock prices tend to remain within some limits, one higher and one below.
The particular feature of the Bollinger Strips is that the distance between them upper and lower lane is based on how volatile a stock or a "product" is.
John Bollinger notes, inter alia, the following for the index:
Major changes in share price often occur when the distance between the upper and lower lanes become smaller.
When the share price comes out of the two lanes, it follows its move share proportional to the slope of the direction line.
The minimum and maximum values that occur outside the two lanes and which are accompanied by minimum and maximum values within the lanes, usually they are directional shifts (the upward course will be down or vice versa).
When the share price meets one of the two lanes, its trend, at the time the next time is to meet the other lane.
This is useful when trying to appreciate upper and lower stock price limits in the near future.

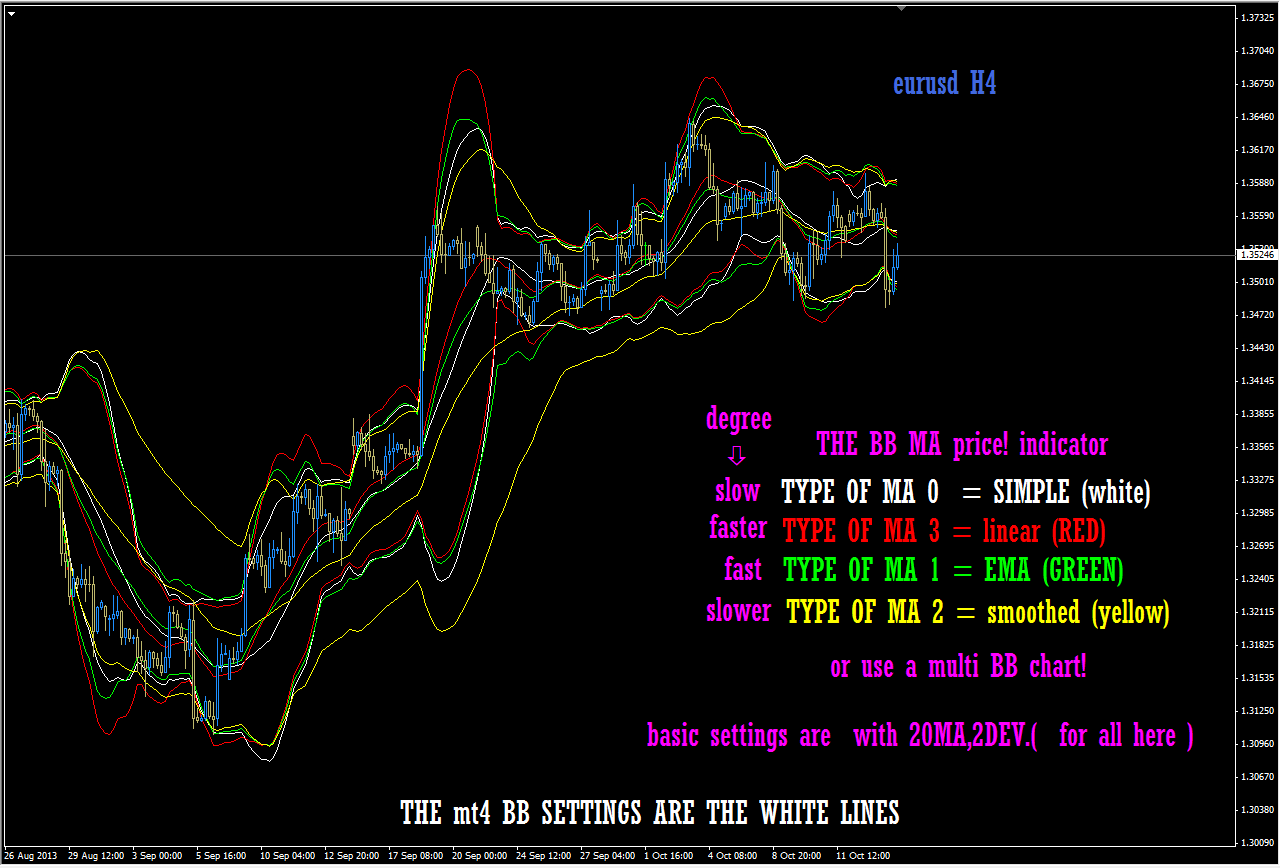
In the above diagram we observe that:
The share at point A is in the upper Bollinger lane. It shows it chart, the overrun of the upper lane is superficial and the share soon recedes to the lower lane.
At point B we notice that the distance between the two Bollinger lanes has significantly reduced. According to Bollinger's comment this means it is imminent significant change in share price - '' product ''.
In the interval now, the share strikes the upper lane 11 times.
This, which followed by the rise in share price (a combination of observations α, β of interpretation).
The interpretation and use of the Bollinger Stripes is more of an art than a scientific method of producing trade marks.
This means, therefore, how trading rules and band behavior are interpreted differently in practice between different analysts. Using ± 2 standard deviations for their range is not binding, as in small shares variability can be used ± 1 standard deviation.

During periods of high price fluctuations it is recommended to we define some areas within which prices are expected to oscillate, so to show their support and resistance.
These lanes provide psychologically levels of price trapping but also conditions for waiting for violent reactions (upstream or downstream).
Bollinger strips consist of a simple 20 day moving medium (such as John Bollinger's inspiration), which is surrounded by two lanes.
The strip above KMO appears if we add to it two standard price deviations. The strip at the bottom of the moving medium occurs when
we deduct from it two standard price deviations.
These two lines are typical deviations are the upper and lower limit of the Bollinger lanes.
When volatility and stock fluctuations increase, then the width
of the Bollinger lanes increases as standard price deviates.
Η direction of the Bollinger lanes depends on the direction of the mobile
through 20 days. The behavior of these lanes depends on
behavior of the price trend.
Within a strong upward trend, Bollinger's lanes are limited width and their direction is upward. When the stress matures and shows fatigue, the lanes open as price volatility increases. In a strongly downward trend, the lanes are narrow and downward.
Cathodic strips with increased width, they mean weakening of downward trend.

The trading rules based on the Bollinger lanes are as follows:
The???? An upward breakdown of Bollinger's upper limit from the closing price, shows strong upward trend and gives a share purchase mark.
The???? If the price breaks up the upper Bollinger limit, then it forms peak below this, expecting price retreat and reversal pre-existing upward trend.
The???? Catalysis of the lower limit of Bollinger marks a fall in price, hence we sell the share or product we are trading on.
The???? If the price breaks down the lower limit but then creates a bottom above the limit then a recovery will take place.
The???? The failure of the price to break the lower limit means a possible start of movement until the upper limit and the opposite for failure to break the upper limit.
The???? An upward movement of the value to the upper limit Bollinger will encounter resistance to this.
The???? A downward movement of the value to the lower limit Bollinger will find support at the limit this.
The???? Every effort of the honor to move nervously from the upper limit to the bottom will encounter at least short - term support in the 20 mobile medium and every bounce of the price from the bottom boundary upwards will find resistance to the same mobile media.
The???? After every dramatic reduction in the range of Bollinger lanes we will expect violent price reaction, the direction of which can be predicted by other technical indicators.
The???? Bollinger strips tend to increase their width in areas price spikes rather than base areas.
The Bollinger strips are an index similar to the mobile environments average. The difference between them is the following: the envelopes are formed with predetermined rates above and below the moving average, while the Bollinger lanes are formed with levels of relative deviation from the mean.
Because the constant deviation is a measure of how volatile a stock is, the bands are modified by themselves, ie widen when the stock's variation is significant and narrow when it is variation is small.
Bollinger strips are shown on the same graph as the stock price.
As is the case with the surrounding environments, the basic interpretation of the lanes is that stock prices tend to remain within some limits, one higher and one below.
The particular feature of the Bollinger Strips is that the distance between them upper and lower lane is based on how volatile a stock or a "product" is.
John Bollinger notes, inter alia, the following for the index:
Major changes in share price often occur when the distance between the upper and lower lanes become smaller.
When the share price comes out of the two lanes, it follows its move share proportional to the slope of the direction line.
The minimum and maximum values that occur outside the two lanes and which are accompanied by minimum and maximum values within the lanes, usually they are directional shifts (the upward course will be down or vice versa).
When the share price meets one of the two lanes, its trend, at the time the next time is to meet the other lane.
This is useful when trying to appreciate upper and lower stock price limits in the near future.

In the above diagram we observe that:
The share at point A is in the upper Bollinger lane. It shows it chart, the overrun of the upper lane is superficial and the share soon recedes to the lower lane.
At point B we notice that the distance between the two Bollinger lanes has significantly reduced. According to Bollinger's comment this means it is imminent significant change in share price - '' product ''.
In the interval now, the share strikes the upper lane 11 times.
This, which followed by the rise in share price (a combination of observations α, β of interpretation).
The interpretation and use of the Bollinger Stripes is more of an art than a scientific method of producing trade marks.
This means, therefore, how trading rules and band behavior are interpreted differently in practice between different analysts. Using ± 2 standard deviations for their range is not binding, as in small shares variability can be used ± 1 standard deviation.
Last edited:


