
[h = 3] Relative Strength Index (RSI)
[/ h]

Also a classic case of divergence is shown in the diagram below
4.14. The highest point of the share for the space presented is C. But
the pointer to C has dropped a lot from its maximum value (near B).
The most basic buying and selling methods with the RSI index are the following:
Every time the RSI breaks down the line of 70 down the mark is sold
while the index breaks the 30 line upwards with a market signal.
But the simple divisions of RSI's over-sold and over-sold lines
they are not particularly reliable signals in practice, as the index is dragged into
multiple disruptions at times of stress that do not reflect purchasing
opportunities or appropriate prices for liquidation, but come from the acquis
speed and excessive price momentum.
Top and base shapes. When RSI forms a top over 70
we have a clue of creating a peak in prices and we even face it
the market could turn downwards with a downward reaction. When RSI
it forms a cavity below 30 we have a base-based indication in the values and
we are preparing for a possible reversal of the market upwards.
Top failure swings and bottom failure swings.
Peak deviation is detected when the pointer forms a high peak above
70 and then forms a second peak also over 70 but
lower than the first, while its subsequent descent under 70 breaks down
its low between these two peaks. The top failure swing is an indication
strong weakness of the stock. Base deviation occurs when the pointer is displayed
forms a low bottom under 30 and then a second bottom as well
below 30 but higher than the first while in the subsequent rise of the index
above 30 breaks the high between these two bottoms. The bottom failure
swing of RSI is a sign of share concentration. Both
peak deviation formations as well as base deviation formations are
short-term phenomena of usual duration of a few weeks.
Geometric formations (chart formations). RSI has the feature to
often displays peak, base or sequencing formations just as well
the values within the bar chart. Many times RSI may display formations
which are not visible in the bar chart of the stock and puts us in increased readiness
for a possible market reaction. Top formations are more
as high as they are in the overvalued zone, while the
base formulations are more reliable as the lower ones are found in
in the underestimated zone.
Support / resistance levels. We can set RSI resistance levels
from the undisturbed peaks formed above 70 and which
correspond to resistance levels of the prices themselves. The splitting of a level
value resistance, preceded by the breakdown of RSI resistance
is clearly considered to be a more reliable share purchase mark.
Positive and negative deviations. When RSI has a negative deviation from
values in an over-sold area, then the extinction indicator appears
and reversing the upward trend in prices. When RSI is positive
deviation from prices and even in a hyper-distressed area then we have indications
assaulted by buyers. The negative and positive deviations differ from the top /
botton failure swings as they are longer-lasting phenomena.
Voltage lines. Just as we do in the prices, we can design
ascending and descending lines in RSI and use the signals
splitting tension lines to prepare to receive
market positions. Locations are triggered by the signals we get from
values and the breakdown of their own voltage lines.
Implementing mobile media in RSI. In order to overcome the impact of
intense and short-lived fluctuations in RSI prices are often added to
chart of the pointer and a moving average (3, 5 or 7 days). When RSI
breaks down his mobile medium into a supermarket, then he is given
sales signal and when it breaks up its mobile medium in a crowded area,
then a purchase mark is given.
Here is an example of a deviation with a MT4 platform

Observe in 4 graph that
1) the basic trend is upward
2) there is a price channel 1-2 through which prices are moving
3) the value is at the bottom 2 channel
4) the dashed yellow line has a large drop candle
5) from then on, but the rsi index does not follow the price drop
have been designed over the rsi channel as well as the prices (one of the rsi uses)
The divergence in the price movement and the rsi motion leads us to the conclusion that we will have a return to the basic upward trend.
although the conclusion is not 100% safe yet has the odds with our part.
when you analyze with rsi everywhere you pull lines of tension and in it as in the prices and notice if they agree !!!
[/ h]
The relative power indicator (RSI) was developed by J. Welles Wilder, Jr. the 1978.
As a momentum indicator, RSI measures the speed of the movement of the values. In this model, the
values are generally considered to be elastic in that they can be moved in limited
just distance from the average before reacting or retreating. The rapid rise of
prices lead to hypermarket situations and the rapid fall to supermarkets
situations. The slope and RSI values are directly proportional to the speed and the
size of the price movement and are extremely useful for tracking
over-sold and over-sold situations.
RSI is the most popular oscillator and is mainly used to
provides warning signals for (a) potential exhaustion of upward or downward trend
of prices; (b) indications of a forthcoming violent reversal of the market; and (c) reliable signals
transactions within trade zones.
The name of the pointer may be misleading because it seems to have the role
comparison of share performance with the general index. A more correct name would be
Internal Power Indicator In fact, it examines how enhanced it seems to be
is the current price of the share in relation to the momentum it has acquired in the last
meetings. From there we can see if the stock is low or
high in relation to the levels he has touched in the past and hence considered
hypermarket or supermarket.
The RSI calculation formula is as follows:
RSI = 100 - (100 / (1 + RS))
where RS is the relative capacity of the stock resulting from the following
procedure:
1. We get the sum of the closing prices of the upcoming meetings
last X days (ie meetings where the closing price has increased
compared to the previous day) and divide it with X
2. We get the sum of the closing prices of their downward meetings
last X days and divide it with X.
3. We divide the number resulting from the step (1) to the step number (2)
and this product is the variable RS.
As for the number of days used in RSI, Wilder in the original
index presentation suggested 14. Several analysts use 9 alternatively
days for shorter-term analyzes. Today the 9 and 25 days are
equally popular. Of course the shorter the period is, the more zig-zag
shows the index.
The feature of RSI is that it is an oscillating indicator
between 100 and zero and has clear limits of overvaluation and devaluation. When the
pointer gets values greater than 70 is considered over-sold while when it falls below
30 is considered to be over-sold. When the pointer moves between 30 and 70
is considered to be in a neutral zone and does not show interest, while the level
the index balance is 50.
A predominant method of analyzing the index is to observe discrepancies
between the index and the share price. If the stock rises continuously, but the
its upward course is not followed by higher Relative Power index values,
things are probably not good. If it's the index instead of reaching a higher price
drops lower than another recent low, while the stock rises to
higher levels ("failure swing"), then things just do not
it is good but rather bad.
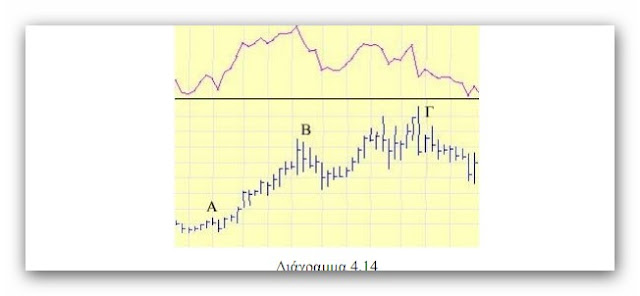
In the diagram below, under A, the index shows that the stock is over-
purchased. In B, the stock is making a new record while the index is lower
(deviation). Here is a price correction. At point C the stock is over-sold (o
indicator is located under 30). This extreme reaction is corrected in the time period
follows.

Also a classic case of divergence is shown in the diagram below
4.14. The highest point of the share for the space presented is C. But
the pointer to C has dropped a lot from its maximum value (near B).

The most basic buying and selling methods with the RSI index are the following:
Every time the RSI breaks down the line of 70 down the mark is sold
while the index breaks the 30 line upwards with a market signal.
But the simple divisions of RSI's over-sold and over-sold lines
they are not particularly reliable signals in practice, as the index is dragged into
multiple disruptions at times of stress that do not reflect purchasing
opportunities or appropriate prices for liquidation, but come from the acquis
speed and excessive price momentum.
Top and base shapes. When RSI forms a top over 70
we have a clue of creating a peak in prices and we even face it
the market could turn downwards with a downward reaction. When RSI
it forms a cavity below 30 we have a base-based indication in the values and
we are preparing for a possible reversal of the market upwards.
Top failure swings and bottom failure swings.
Peak deviation is detected when the pointer forms a high peak above
70 and then forms a second peak also over 70 but
lower than the first, while its subsequent descent under 70 breaks down
its low between these two peaks. The top failure swing is an indication
strong weakness of the stock. Base deviation occurs when the pointer is displayed
forms a low bottom under 30 and then a second bottom as well
below 30 but higher than the first while in the subsequent rise of the index
above 30 breaks the high between these two bottoms. The bottom failure
swing of RSI is a sign of share concentration. Both
peak deviation formations as well as base deviation formations are
short-term phenomena of usual duration of a few weeks.
Geometric formations (chart formations). RSI has the feature to
often displays peak, base or sequencing formations just as well
the values within the bar chart. Many times RSI may display formations
which are not visible in the bar chart of the stock and puts us in increased readiness
for a possible market reaction. Top formations are more
as high as they are in the overvalued zone, while the
base formulations are more reliable as the lower ones are found in
in the underestimated zone.
Support / resistance levels. We can set RSI resistance levels
from the undisturbed peaks formed above 70 and which
correspond to resistance levels of the prices themselves. The splitting of a level
value resistance, preceded by the breakdown of RSI resistance
is clearly considered to be a more reliable share purchase mark.
Positive and negative deviations. When RSI has a negative deviation from
values in an over-sold area, then the extinction indicator appears
and reversing the upward trend in prices. When RSI is positive
deviation from prices and even in a hyper-distressed area then we have indications
assaulted by buyers. The negative and positive deviations differ from the top /
botton failure swings as they are longer-lasting phenomena.
Voltage lines. Just as we do in the prices, we can design
ascending and descending lines in RSI and use the signals
splitting tension lines to prepare to receive
market positions. Locations are triggered by the signals we get from
values and the breakdown of their own voltage lines.
Implementing mobile media in RSI. In order to overcome the impact of
intense and short-lived fluctuations in RSI prices are often added to
chart of the pointer and a moving average (3, 5 or 7 days). When RSI
breaks down his mobile medium into a supermarket, then he is given
sales signal and when it breaks up its mobile medium in a crowded area,
then a purchase mark is given.
Here is an example of a deviation with a MT4 platform

Observe in 4 graph that
1) the basic trend is upward
2) there is a price channel 1-2 through which prices are moving
3) the value is at the bottom 2 channel
4) the dashed yellow line has a large drop candle
5) from then on, but the rsi index does not follow the price drop
have been designed over the rsi channel as well as the prices (one of the rsi uses)
The divergence in the price movement and the rsi motion leads us to the conclusion that we will have a return to the basic upward trend.
although the conclusion is not 100% safe yet has the odds with our part.
when you analyze with rsi everywhere you pull lines of tension and in it as in the prices and notice if they agree !!!
Last edited:


